
40-year modelling spreadsheet
More actions
The 40-year modelling spreadsheet is also called the financial modelling spreadsheet, the Radical Routes spreadsheet, or the 40-year spreadsheet. This may also refer to the business plan or simply, the plan - although sometimes the business plan also includes a narrative to go alongside the spreadsheet.
This spreadsheet gets updated regularly, sometimes multiple times a year, by Catalyst Collective. At the time of writing, in May 2025, the most up to date version is version 3.3.5. The latest version of the spreadsheet gets updated and is available in the RRModel Spreadsheet online file storage.
The spreadsheet works best when downloaded to a device, and opened using Libreoffice - in the .ods file format. Libreoffice is a free, open source office suite similar to Microsoft Office. Once Libreoffice is downloaded, the spreadsheet software we recommend using, and that the spreadsheet was designed to be used on, is called LibreOffice Calc. It is possible to use Google Sheets or Microsoft Excel however we have noticed glitches in the calculations and protected cells, therefore advise against it.
Information required to enable filling in the spreadsheet
It can be quite overwhelming to look at this spreadsheet. Some people with more spreadsheet experience have taught themselves how to use it. We recommend collecting all of the figures needed before trying to fill it in. Radical Routes Finance Group are happy to be contacted for advice or support to fill this in.
If you are trying to fill in the spreadsheet, it will help to have the following information to hand. This guidance has come about from filling in the spreadsheet for an already housed coop. Much of it will also be applicable to an unhoused coop, and in some places estimate figures will need to be used.
- Cash in the bank - This is total money in the co-op's name, in all co-op bank accounts, including savings.
- Fixed assets - Find this information on the most recent balance sheet, representing the value of all property owned by the coop. This is zero if your co-op does not own any property.
- Rental income - Be careful to input this correctly, either per week or per month
- The most recent mortgage statement - The information needed from this document is 1) capital balance, 2) interest rate, and 3) monthly payment.
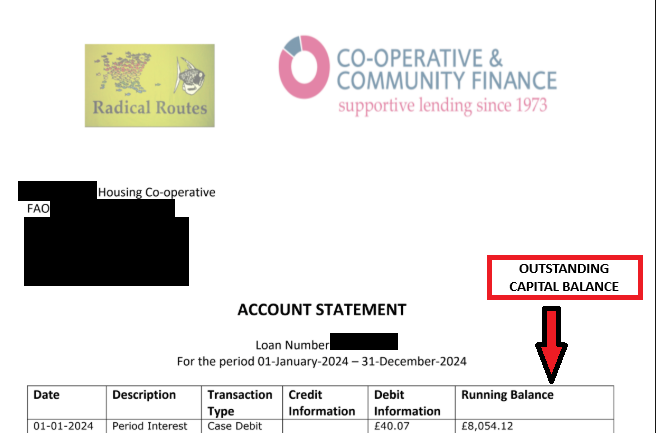
- Radical Routes loan statement - The header of this document should say Co-operative & Community Finance as well as Radical Routes because CCF administer RR loans. The information needed from this document is 1) capital balance, 2) interest rate, and 3) monthly payment
- Outstanding loanstock details - This should include 1) starting dates, 2) length in years, 3) interest rate, 4) amount, 5) simple/compound interest. The name of the lender should only include the initials, so for example loanstock from Zara Chowdhary should appear as 'ZC'. This is so that when the spreadsheet is shared externally, the loanstock investors are not identifiable.
- Annual council tax
- Annual insurance cost
- Annual maintenance spend - This could be the average over 3 years, or an annual maintenance budget, or an estimate with a minimum of £250 per bedroom per year.
- Local Housing Allowance rate - LHA is calculated by inputting the postcode of the property on the government LHA calulator. The figure we generally use is the shared accommodation rate - correlating to one person paying 1 rent per bedroom. However, other rates may be applicable if, for example, a member is entitled to the 1 bedroom rate if they are receiving disability benefits, more bedrooms if they have dependents etc.
- Bank charges - Many RR coops bank with Coop bank (free), or Unity Trust Bank (£6 per month = £72 per year).
- RR member payments Check your bank statement for how much you pay RR (quarterly) if you are a member of RR. This will correspond to a drop-down menu on the spreadsheet.
- Any other regular income - For example - regular donations.
- Any other regular expenses - For example, travel, website hosting costs, internet or a building service charges. This should not include electric, gas or water bills as RR recommends these costs are dealt with as separate from the co-op's expenses, and housing co-ops charge separately for bills. The spreadsheet may or may not include internet expenses, depending on whether this is paid for by the coop.

How to input data into the spreadsheet
Only the purple cells are editable. It is recommended to keep the spreadsheet in protected mode so as not to change any of the formulae.
Broken down by sheet
Sheet 1) - Information and Ongoing income & expenditure
This sheet goes by the shorthand name Info and Ongoing Inc&Exp
Income to input: rental income and other income.
Expenses to input: void percentage; house insurance; maintenance; council tax; bank charges; accountant costs; other expenses.
For co-ops applying for a RR loan, rental income will need to be below LHA. Co-ops should be aware of the risk to losing their exemption for corporation tax if they are receiving any income that is not rent from members.
For insurance, maintenance, and council tax - you can input these as either actual costs or estimated. This won't have any impact on the model and is more to give some background to the figures.
Sheet 2) - Income and expenses needed at the start
One reason you might be filling in this spreadsheet is, for instance, you are modelling for an upfront cost to the coop. You can use the sheet (shorthand - Day1 Inc&Exp) to represent initial costs that are not repeated year on year.
Data to input - Cash in the bank; day 1 expenditures (such as property purchase cost, mortgage fees, RR loan fees, Day 1 maintenance work, surveys etc. Scrolling down to the bottom of this page you should also input the value of any existing properties. The mortgage fees can be either inputted manually or automatically derived from the new mortgage information.
If you are not taking out any loans, ensure you remove any loan fees on this sheet.
Sheet 3) - Existing Loans
This page calculates how much already existing loans money the coop owes. This could be a mortgage, a "mortgage-type" loans (e.g. RR loans that are repaid on a monthly basis), or loanstock (i.e. loans being reimbursed at once at the end of their maturity period).
The capital balance reading date is the last date covered on the most recent loan statement.
The remaining capital balance is the amount of the loan that the co-op is due to repay - this could be in the tens or hundreds of thousands of pounds.
Sheet 4) - New Loans
This page models for any new mortgage-type loans, future mortgage-type loans, new loanstock, and future loanstock. The difference between new and future is that new starts from the 1st year the spreadsheet is set in, whereas future can be set up to start at any point in the next 40 years.
There are three types of interest rate for mortgage-type loans: fixed, variable and RR rate. The RRrate stands for RR loan that are at the lowest interest rate. Indeed this lower interest rate is based on the average interest rate requested by RR investors which might fluctuate. For RR loan at 6% however this should be set as a fixed rate.
Automatic Loanstock Refinancing
There is also a function in the 'Future Loanstock' section to turn on automatic refinancing. This is where the spreadsheet automatically adds in extra loanstock when it is needed. You can turn this on/off by selecting yes/no in the dropdown. To see the where the automatic loanstock has been added in, go to the Yearly Breakdown page - Money In - Loanstock In, and scroll across to see any non-zero figures. Loanstock In also appears as green vertical bars on the graph at the bottom of the Yearly Breakdown page.
Sheet 5) - Year 1 Breakdown
This page shows you how viable the plan is in Year 1, broken down by months 1-12. Each column represents 1 month, and you need to scroll sideways, to the right, to see all 12 months.
If you need to input specific income or expenses in Year 1 in a specific month, you can input this here.
For example - You are going to start doing renovations on a bedroom in month 3, and then the rent from that bedroom only becomes available in the 6th month after the spreadsheet begins. In this case you would:
1) input the extra maintenance cost in 'Year 1 breakdown', under the 'Money Out' section, in the 3rd month, in a purple cell - either in Cell H42 (maintenance), or Cell H50 (other) is fine. 2) input the full rents in the 'Info and Ongoing Inc&Exp' sheet, and then in the 'Year 1 Breakdown' sheet, reduce 1 rent level for the first 5 months. This would represent that the first 5 months has 1 less rent coming in.
Sheet 6) - Yearly Breakdown
This page shows you how viable the plan is throughout the 40 years, broken down by years 1-40. Each column represents 1 year, and you need to scroll sideways, to see all 40 years.
Check that the rate of inflation is set to 3%, and the rent increase rate is set to at least 2%.
There is a 3% increase in the ‘Mortgage Interest rate change’ sheet over the first 10 years. This is how we stress test for unforeseen interest rate hikes. The actual interest rate is inputted per loan in the New Loans or Existing Loans sheet. The lender's interest rate (often Ecology Building Society, or Triodos) includes the Bank of England 'base rate' that fluctuates.
Testing the viability of the spreadsheet
Once all sheets have been filled in, there are a number of things to check that the business plan is viable/sustainable, that income covers all expenditure, and that the bank balance remains positive.
On the Info and Ongoing Inc&Exp sheet, scroll to the bottom of the page, and check that the ongoing surplus is positive and ideally above £1200 per year.
On the Year 1 Breakdown sheet, scroll to the bottom of the page, and check that the balance is positive. Scroll to the right and check all 12 month bank balances are positive.
The Yearly Breakdown page is the main page to pay attention to to see that the business plan is viable. The bank balance needs to be positive at all times. On version 3.3.5 of the spreadsheet, the Bank Balance appears on Row 93, but in other versions it may appear higher or lower than this.
At the bottom of the Yearly Breakdown page, there is a graph that represents the bank balance over 40 years. This should have an upward trend, which means that the co-op is accumulating money over time and therefore can cover any unexpected costs.